7964
Lecture 8
In Lecture 7, we discussed the binomial and the poisson probability distributions.
Here, we'll discuss random variables, as well as the all-important Normal Distribution.
A. Random Variables
A random variable
assigns a number to each outcome of a random circumstance; that is, a random variable
assigns a number to each unit in a population.
Suppose you are planning a outdoor graduation party. What are some of the
random factors that will affect how enjoyable the event will be? The temperature
will likely affect how enjoyable the event will be; as will the amount of
rain (or simply whether it rains); as will the number of airplanes that fly
overhead.
Ask yourself--are the following variables discrete or continuous?
- Temperature
- Whether it rains or not
- Amount of rain in inches (ranging from 0 upward)
- Number of airplanes that fly overhead
Click
here
for the answers.
B. Discrete Random Variables
The probabilities and probability distributions that we discussed in Lecture
7 were focused on discrete variables--for instance, the number of outcomes of
"heads" across three tosses of a fair coin, or the number of red cars that
are found in a parking lot, or the number of skiers who break a leg.
These could be considered in the context of
binomial experiments or binomial probability distributions:
- There were a predetermined number of observations or Bernoulli
trials; in the case of the parking lot, it was 200 cars; in the case
of the skiers, it was 5 skiers; in the case of the coin toss, it was 3
coin tosses.
- For each observation or trial, there were only two possible outcomes.
In the case of the parking lot, each of 200 cars could be red (or not);
in the case of the skiers, each skier could break a leg (or not); in the case
of the coin toss, the coin could land heads (or not).
- All the observations were independent. So, the color of one car in the
parking lot didn't influence the color of the other cars; whether or not the
first skier broke his leg didn't influence the probability that any other
skiers broke a leg; the outcome on the first coin toss didn't influence the
outcome on the other coin tosses.
- The probability of success is identifical for each trial;
the probability that a car was read was .10; the probability
that each skier would break a leg was .2; the
probability that each coin toss would come up heads was .5;
And, in the case of the red cars, we approximated the binomial
distribution with the poisson distribution--since we had
a relatively large sample size, and since the likelihood of
finding a red car was relatively low.
C. Continuous Random Variables
In Lecture 8, we turn our attention to continuous random
variables.
- The probability density function for a continuous random
variable X is a curve such that the area under the curve over an
interval equals the probability that X is in that interval.
In other words, the probability P(a ≤ X ≤ b)
is the area under the density curve over the interval between the
values a and b.
- Let's consider the simplest example of a continuous random
variable: a uniform random variable.
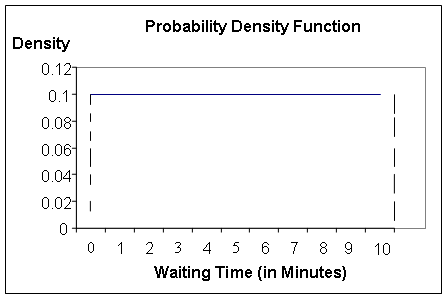
Consider the following example:
A bus arrives at a bus stop every 10 minutes. If a person arrives at
the bus stop at a random time, how long will he or she have to
wait before the next bus arrives?
- The random variable in this case is "amount of time until
the next bus arrives." This is a continuous variable, because the
amount of time could be any value between 0 and 10 minutes. In
practice, of course, the limitations of measurement means that
we round off the exact time.
- Below is the probability density function for the waiting time.
Possible waiting times are along the horizontal axis, and the
vertical axis represents the probability. The
hight of the curve (in this case, it's a line) is .1 for all X between
0 and 1, so the total area between 0 and 10 minutes is (10)(.1)
- Suppose we wanted to find out the probability that the waiting
time X was in the interval 5 to 7 minutes. The general principle
for any continuous random variable is that P(a ≤ X ≤ b)
is the "area under the curve" over the interval from a to b.
So, the probability in this example can be represented as below:
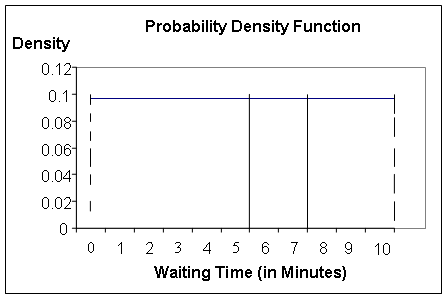
The probability that the time waited falls in the interval between 5 and 7
is represented by the area between the two vertical lines by 5 and 7.
Recall the graphs of the binomial distributions--they were actually bar
charts. Why would bar charts be used for binomial distributions, but
not be appropriate for normal distributions?
Click
here
for the answers.
Note that theoretically, the use of calculus is needed to find the area under
a density curve--but in practice, tables of appropriate probabilities
are usually available.
What would be the total area of the curve?
Click here
for the answer.
In reality, of course, a uniform distribution is unusual, and generally
would not represent interesting questions.
Let's consider the normal distribution.
The following (taken from Hale) is a normal distribution:
The normal distribution is
actually a family of individual normal distributions.
Each normal distribution looks different--in terms of peak and spread--based on
two properties or parameters.
A. Mean
The mean of the normal distribution is the location about which the
distribution is centered. In terms of notation, the symbol µ (mu) is used for
the mean.
B. Standard Deviation
The standard deviation, as you may recall, is a measure of dispersion, or
a measure of spread in the data. In terms of notation, the symbol σ
(sigma, lower case) is used for the standard deviation.
Recall as well that the variance is merely the square of the
standard deviation.
The formula for the variance is:
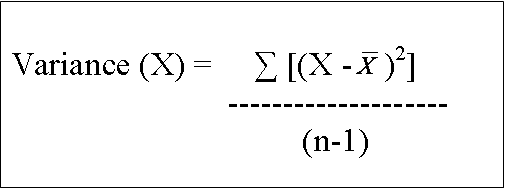
That is, for each observation, subtract the mean of X from the
value of X--and then square that difference. Then add up all those squared
differences, and divide by (n-1) (because we're assuming this is a sample).
The variance represents a measure of the average squared distance from the
mean.
[The subscript i=1 at the bottom of the sigma summation sign merely tells you
to start adding at case 1. And the subscript i=n at the top of the sigma summation
sign merely tells you to add up until and including the nth case.]
How does the normal distribution relate to the binomial distribution?
Well, if X is a binomial random variable with a large n, then X is also
approximately a normal random variable. In other words, the normal distribution
approximates the binomial distribution.
III. The Empirical Rule for the Normal Distribution
According to the empirical rule, and as illustrated above, all
normal density curves satisfy the following property:
- 68% of the observations fall within 1 standard deviation of the mean
- about 95% of the observations fall within 2 standard deviations of the mean
- 99.7% of the observations fall within 3 standard deviations of the mean
Also,
- The distribution of a normal distribution is symmetrical about the mean
- The mean is also the median and the mode
Click
here to see an example of a normal distribution: heights of American women.
IV. Z-scores
Z-scores are essentially standardized scores for X (given that X has a normal
distribution).
A. Calculating Z-Scores
To calculate z scores, we simply standardize the values of X:
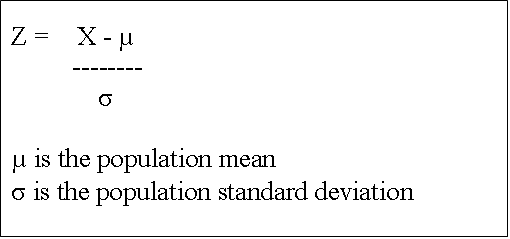
So, let's look at an example. Data collected in several classes suggest that
the distribution of the heights of college women can be described reasonably
well by a normal curve with mean µ=65 inches, and a standard deviation
σ=2.7 inches.
Given this, answer the following questions:
- What is the value of z for a height of 62 inches (5 feet 2 inches)?
Click
here
for the answer.
- According to the empirical rule, in what range of heights do roughly 99.7%
of the observations fall?
Click
here for the answer.
B. Cumulative Probabilities for Z-Scores
Most methods books contain a table of probabilities for the standard
normal distribution (that is, for z-scores).
Such a table can be found
here.
The body of the table contains P(Z ≤ z*). The table
I've linked gives probabilities that Z falls between 0 and the absolute value
of the number in question.
Looking at the table, let's do a few examples.
- What is the probability that Z is less than 1.31 -- that is,
what is P (Z ≤ 1.31)?
Click here
for the answer.
- What is the probability that Z is less than or equal to -2.59--that is,
what is P (Z ≤ -2.59)?
Click here for the answer.
- Returning to the example of college students and height, what is the probability
that height will fall between 5 feet 1 inch, and 5 feet 4 inches? That is, if
height is variable X, measured in inches, what is P (61 ≤ X &# 64)?
Click here for the answer.
Click
here for
a (rough!) illustration of each of the above answers.
- One more--you are a college aged female, who has been told that your height
is in the 80% percentile of all heights of college age females. The average
height is 65 inches; the standard deviation is 2.7 inches. What is your height?
Click here for the
answer.
In other words, every probability problem about a normal curve can be solved
using z-scores, as long as you know the mean and the standard deviation.
__________________________
To summarize,
- if you want to know the cumulative probability P(X ≤ k)
(k is just a constant):
- Calculate a z-score for the value k (based on the mean and standard deviation
given).
Call that z-score: z*
- Use a table, calculator, or computer to find P(Z ≤ z*)
- if you want to know the value of a variable X for a specified percentile ranking
(or cumulative probability) for a normal random variable -- that is, if you want
to know what SAT score is at the 80th percentile score:
- Find the z-score that has the specified cumulative probability (in the SAT example,
it's 80%--or, in the table that we've been using, .3000 (because it's not including
the .50 area of the chart that's below 0).
- Calculate the value of the variable that has the z-score found in step 1.
- If you want to know the percentile ranking for a particular value of X,
when X is a normal random varaible, then
- Find the value z* for which P(Z ≤ z*) = p
using a table, computer, or calculator.
- Then compute x = z* + µ.
V. Statistics and Sampling Distributions
Let's step back and define a few terms, before we go on to discuss why the
normal distribution is so very important.
- A statistic is a numerical value computed from a sample. Examples of
statistics, when the sample consists of a quantitative variable, are the mean,
the median, an dthe standard deviation.
- A parameter is a number associated with a population--and it is generally
assumed that the values of parameters are fixed. For instance, the mean height
for a sample of students at LSU may change from sample to sample--but at any one
point, the mean from the population is constant.
- Note that for categorical variables, statistics associated with as ample
include the number or proportion of the sample who fall into certain categories.
So, a categorical variable might be "greater than 6 feet tall"--and there may
be a frequency (say, 50 out of 200 students) plus a proportion (.25) are
statistics that are associated with this sample of 200 students.
- A sampling distribution of the statistic is the distribution of
possible values of a statistic for repeated samples of the same size from a
population. So, say you were taking repeated samples from the population of
students at LSU--you could calculate a mean for each sample. Say you took 1,000
such samples--you'd have 1,000 means, and that would be a sampling distribution of
the mean. We'll talk more about that below.
Sampling Distributions for Sampling Proportions
Suppose we conduct a binomial experiment with n trials, and get successes on x of the
trials. Or, suppose we measure a categorical variable for a representative
sample of n individuals, and x of them have responses in a certain category. In each case,
we can calculate p = the sample proportion, = x/n. For the
first example, it's the percentage of trials that had that particular outcome
(i.e., the percentage of red cars out of 200 cars); in the second case, it might
be the proportion of individuals who answered "yes" to a question about support
for the President.
Another example: suppose we wanted to know what proportion of a large population
carries the gene for a certain disease. We could sample 25 people, and
use the sample proportion from that sample to estimate the true parameter -- the
true proportion. Suppose that in reality, in truth, 40% of the population carries
the gene.
Consider four different samples of 25 people taken from this population. Remember
that we are trying to estimate the proportion of the population with the gene
(that is, we are trying to estimate the parameter proportion),
based on the sample statistic or sample proportion. We do
not know the population proportion (that is, we do not know the parameter).
Here is what we would have concluded about the proportion of people who carry
the gene, given four possible samples with X as specified:
- Sample 1: X=12, proportion = 48%
- Sample 2: X=9, proportion = 36%
- Sample 3: X=10, proportion = 40%
- Sample 4: X=7, proportion = 28%
In practice, only one sample is collected--and there is no way to tell determine
for sure whether or not the sample is an accurate reflection of the population.
However, researchers have claculated what to expect for the vast majority of
possible samples.
VI. Normal Curve Approximation Rules: Sample Proportions & Means
A. Sample Proportions
As noted above, the normal distribution approximates the binomial
distribution, for large sample sizes. Well, when we think about the
proportions above--they are all just frequencies divided by n. But dividing
by n doesn't change the the shape of the distribution of possible values.
So the sampling distribution for a sample proportion is approximately normal.
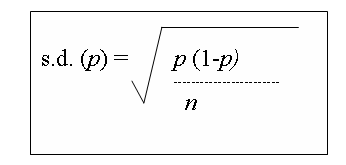
Put differently, if you actually started collecting samples as above--and collected,
say, 30 samples of 25 people each--the 30 proportions that you calculated, together,
would have a normal distribution, with
- a mean of p (the sample proportion)
and a
- standard deviation = s.d. (p) =
the square root of
[(p(1-p) / n ]
This rule applies under the following conditions:
- The Physical Situation: There exists an actual population with a
fixed proportion that has a certain trait, opinion, disease, or some other
characteristic that we are interested in (the survey
example)-- or -- there exists a repeatable situation in which a certain outcome is likely to occur with a fixed relative
frequency probability (the skiing example).
- A random sample is selected from the population, thus ensuring that the
probability of observing the characteristic is the same for each case or
sample unit OR the situation is repated numerous times, with the outcome each
time independent of all other times.
- The size of the sample or the number of repetitions is relatively large.
Remember that N is the sample size--and P is the probability of a "success"
(or that the event in which we are interested occurs). N*P and N*(1-P) must
be at least 5, and it is preferable if they are at least 10. Recall in the skiing
example that there were only 5 trials, and that the probability of breaking a leg
was .2. N*P = 5 * .2 = 1; N * (1-P) = 5 * .8 = 4. So the skiing example
really doesn't have enough trials to qualify--in order to say that a sample
proportion of skiers who broke their legs fit the normal distribution, you'd
have to have more skiers going down the hill.
Let's think about an example. Suppose that of all voters in the United States,
40% are in favor of Candidate X for President. Pollsters take a sample of 2,400
voters. What proportion of the same would be expected to favor Candidate X?
The rule tells us that the proportion of the sample who favor candidate X is a random
variable that has a normal distribution with an estimated
mean of .40 (or 40%) and a standard deviation of the estimated
proportion.
Which, given that p=.4 and n=2400, equals .01.
This standard deviation of the esimated p is called the standard error.
B. Sample Means
Roughly the same reasoning applies to sample means.
Throughout the last few lectures, we've discussed the reality that sometimes
we just have one sample--we don't have perfect information about the
system. So, we're estimating the mean--and fairly often, we're estimating the mean
just from our one sample (not from multiple samples, and certainly not from the population).
But imagine that you did have the luxury of running repeated samples.
You could collect an infinite number (or very high number) of samples of
the population that you're interested in, and then calculate out a mean from every
one of those samples. You'd end up with a collection of data like this:
________________________
- Sample 1 ---> Mean 1
- Sample 2 ---> Mean 2
- Sample 3 ---> Mean 3
- .......
- .......
- .......
- Sample 1,000,000 ----> Mean 1,000,000
- Sample 1,000,001 ----> Mean 1,000,001
________________________
With this very large (even infinite) number of samples that you could draw
from a population, the means wouldn't all be the same. The mean X of
the sample that you drew today might be different than the mean X of the sample
that you draw tomorrow.
So, those means can be thought of as a variable -- a continuous variable --
in and of themselves. Those means have a mean, and a standard deviation.
What can we expect for the possible distribution of sample means in repeated
sampling from the same population. We call this rule the Normal Curve
Approximation Rule for Sample Means of simply the Rule of Sample Means.
It applies in the following types of situations:
- Either the population is bell-shaped (normal) and a random sample of any
size is measured, OR
- The population is not bell-shaped--but a large random sample is
measured.
What is "large"? 30 is usually used as a somewhat arbitrary standard for
large, but (1) it is always better to have a larger sample, particularly if
there are outliers, and (2) there are sophisticated statistical tests to
assess whether your sample is large enough.
The rule tells us that those sample means would have an (approximately)
normal distribution, with a mean = µ (that is, the same mean as the
population mean) and a standard deviation of σ / (square root (n).
Let's think about an example. A weight loss clinic is interested in measuring
the average weight loss for participants in its program. It makes the assumption
that the weight losses will be bell-shaped, so the Rule for Sample Means
will apply for any sample size. The population of interest is all current and
potential clients and the measurement of interest is weight loss. Imagine that
the population mean µ = 8 pounds, and the standard deviation σ = 5
pounds. We are taking random samples of size 25.
- We can think of repeated samples being taken from this population, of
calculating a sample mean weight loss from each sample drawn--and then
collecting a sample of sample means.
- From The Empirical Rule, we know that there is a 68% chance that the
sample mean will be between 1 standard deviation above, and 1 standard deviation below
the mean of the sample means, that 95% of the observed sample means will fall
within 2 standard deviations above and below the mean sample mean, and
that almost all the observed sample means will fall between three standard deviations
above and three standard deviations below the mean sample mean.
- From the formula above, we know that the mean of the sample mean will
be the same as µ=8 pounds.
- From the formula above, we know that the
standard deviation of the sample means will be the standard deviation of
weight loss (σ=5 pounds) divided by the square root of n (n is 25, so the
square root of n is 5). That is, we can calculate the standard deviation of the
sample means as = 1.
- So we know that 68% of the observations should fall between 7 and 9.
- And we likewise know that 95% of the sample means will be between 6 and 10.
- And we know that it is almost certain that the sample mean will be between
5 and 11.
What happens if we expand the sample size significantly--for instance, in the
above example, if we sampled 100 individuals rather than 25? In general, a
fourfold increase in sample size cuts the standard deviation of the distribution
of possible means in half, a ninefold increase in sample size (in this case, sampling
225 individuals) will cut the standard deviation to about a third of what it was, and so on.
In other words, larger samples mean more accurate estimates--and less bouncing around
of the mean from sample to sample.