Post-Hurricane
Katrina
Research Maps
by the LSU Katrina Survey Team
Department of Sociology, LSU
(preliminary
and exploratory)
See here for maps of Neighborhood Characteristics
Interviews per Neighborhood
With
a sufficient number of Interviews, we can investigate processes like
The efficacy of Neighborhood-Association strategies for recovery,
Social
influences on the crime rate,
And other
macro and multi-level
processes.
Sample Size is N = ca. 7,000
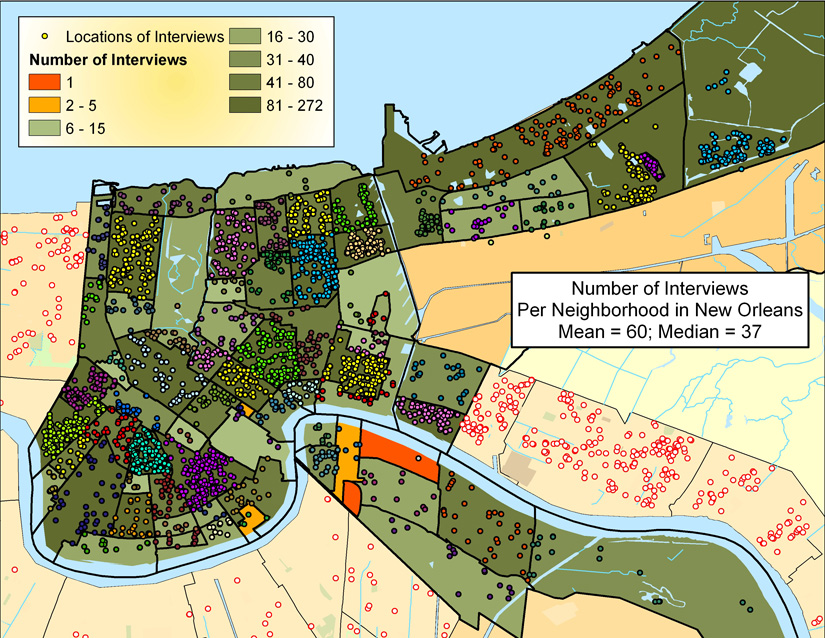
(Hollow red dots are interviews outside Orleans Parish)
![]()
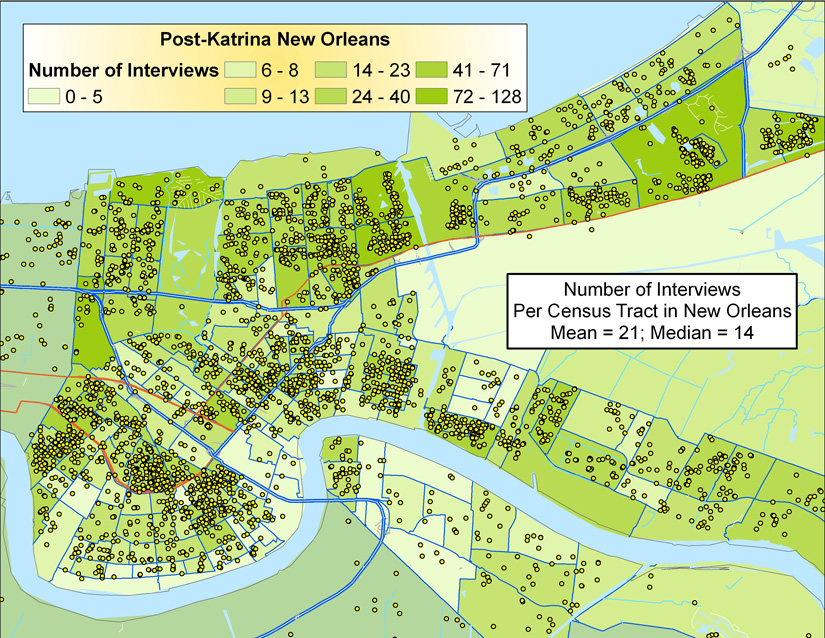
Interviews per Census Tract
This is more fine-grained than Neighborhoods,
and consequently, has fewer average interviews per district.
Sample Size is N = ca. 7,000
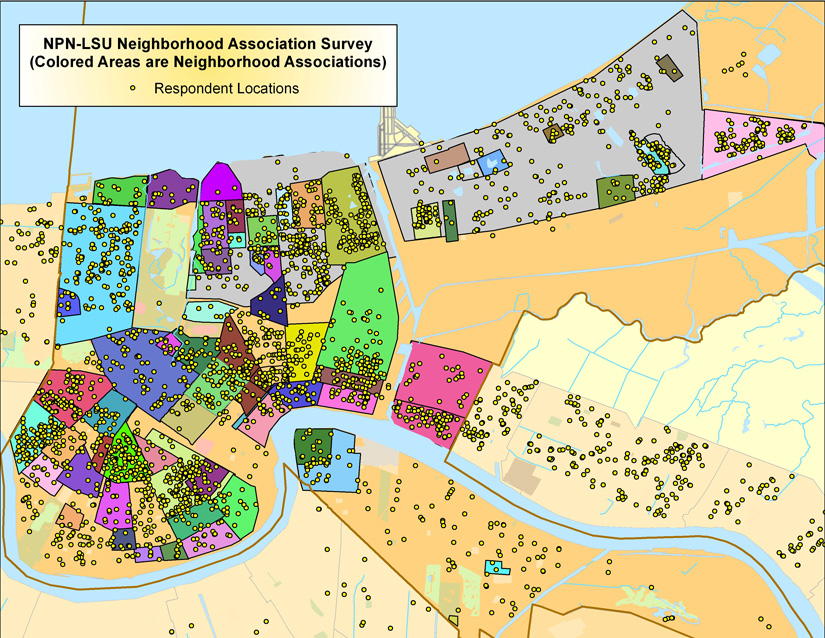
Neighborhood Associations
We
are investigating the efficacy of
Neighborhood-Association strategies
for recovery,
Sample Size is N = ca. 7,000
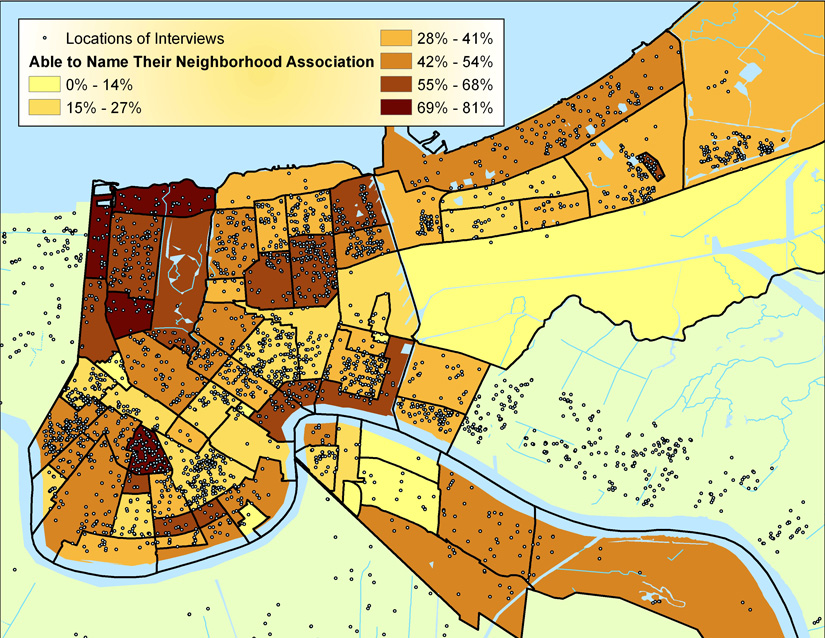
Detailed View:
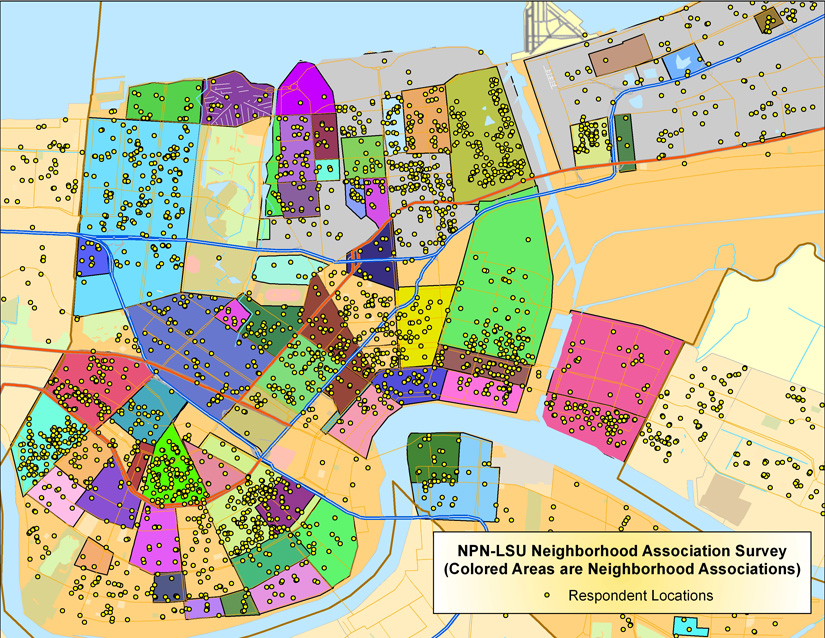
Not all neighborhood associations have responded to our survey yet.
How many people know the name of their
Neighborhood Association?
Selected Findings Mapped
Note: We use the finest (smallest) "district" size we can, consistent with getting reliable data/averages per district
Source
of Repopulation data: Greater
New Orleans Community Data Center and
Vallasis Lists Data;
Source of flood layers: US
Geological Survey;
Source
of all
other data: LSU Disaster Recovery Survey
A Sequential View of Rebuilding*
*The Sequence shows:
|
Source
of Rebuilding Data: University of New Orleans Geography Department
Surveys
Source of flood layers: US
Geological Survey.
Physical Characteristics:
Flooding caused Damage,
Damage created Blight, and
Damage hindered Repopulation
But where do Social Characteristics fit into the picture?
Extent of the Flooding
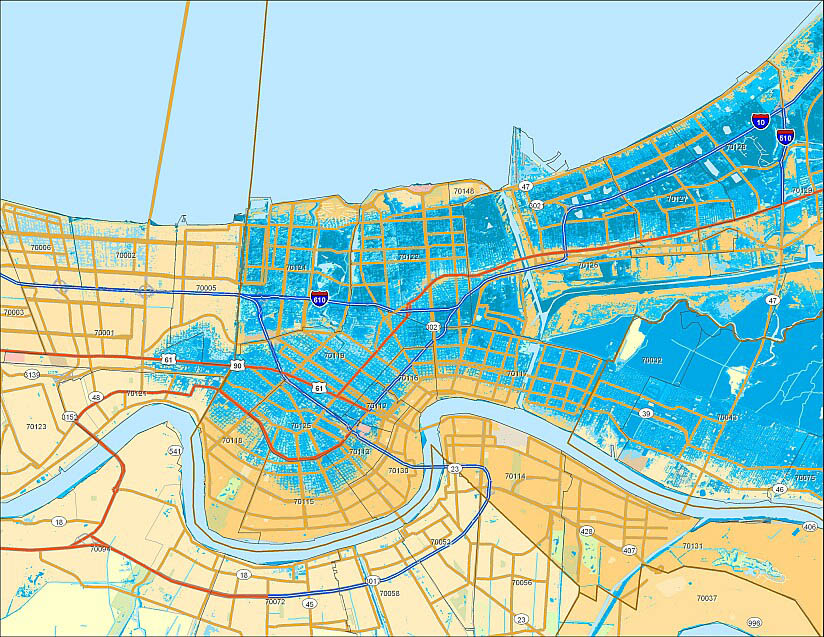
Source
of flood layers: US
Geological Survey.
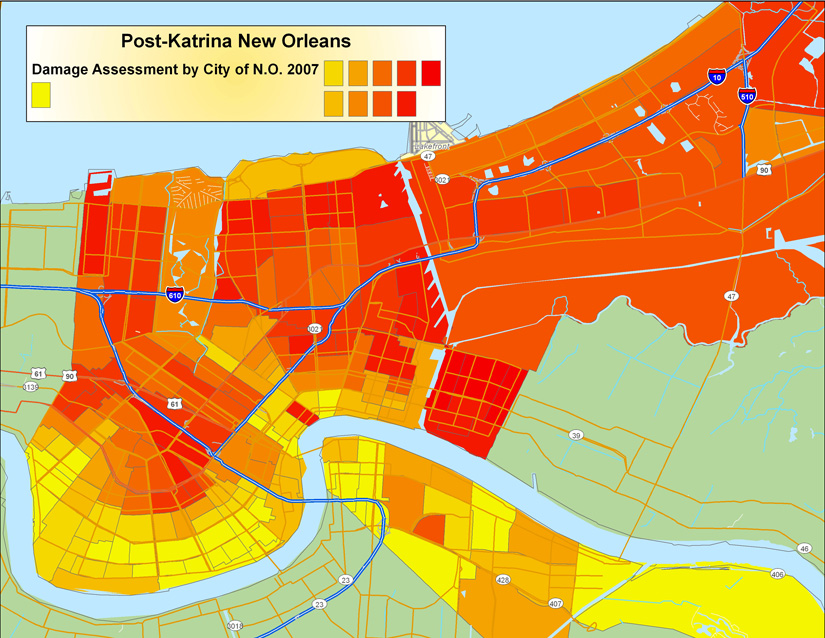
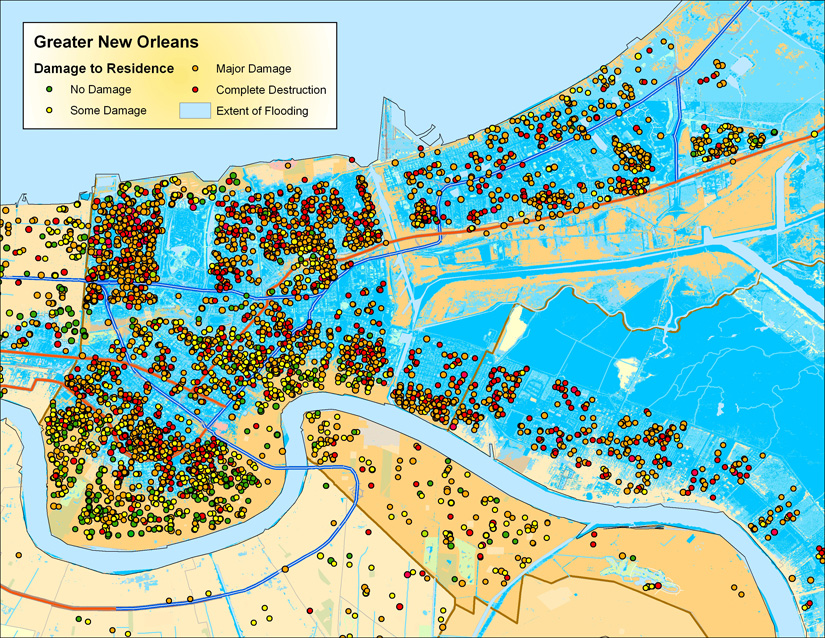
Damage
to Residences
Damage corresponds to flooded areas.
Source
of housing damage layer: City of New Orleans.
Damage to Residences per Census Tract
Source of Damage data: City of New Orleans
Blight (mean quarterly rate, 2006-2010)
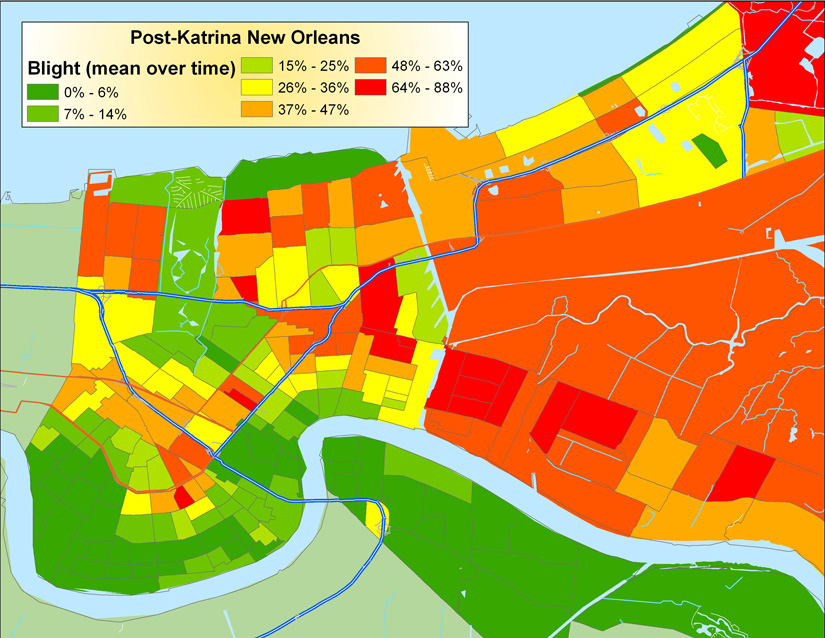
Source
of Blight data: U.S. Department of Housing and Urban Development (HUD)
and the United States Postal Service (USPS): here
Reduction of Blight, 2006-2010
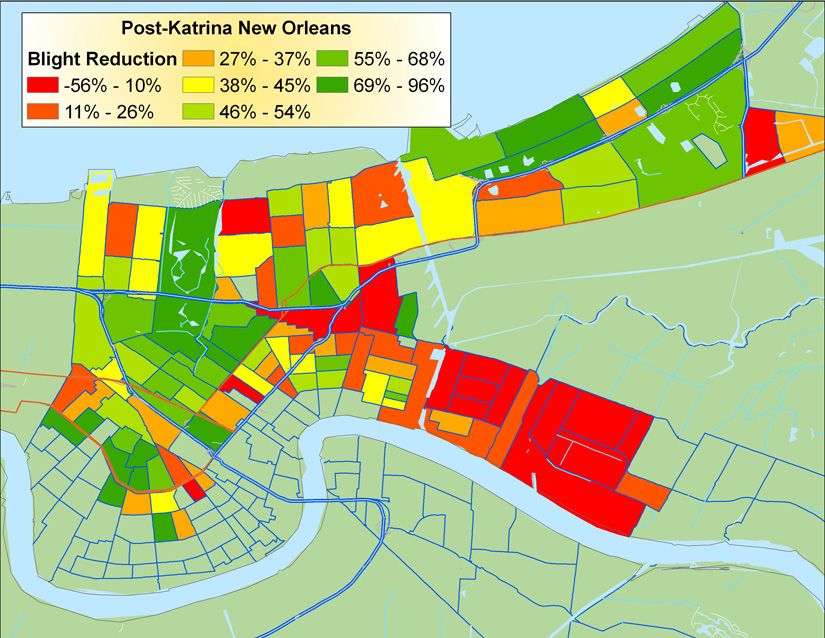
Map shows only census tracts that flooded substantially.
Map excludes housing developments (because the government demolished & rebuilt them),
and tracts that had less than 10% blight in 2006 (because small changes would represent large percentage changes).
Source
of Blight data: U.S. Department of Housing and Urban Development (HUD)
and the United States Postal Service (USPS): here
Demolitions by City, 2011
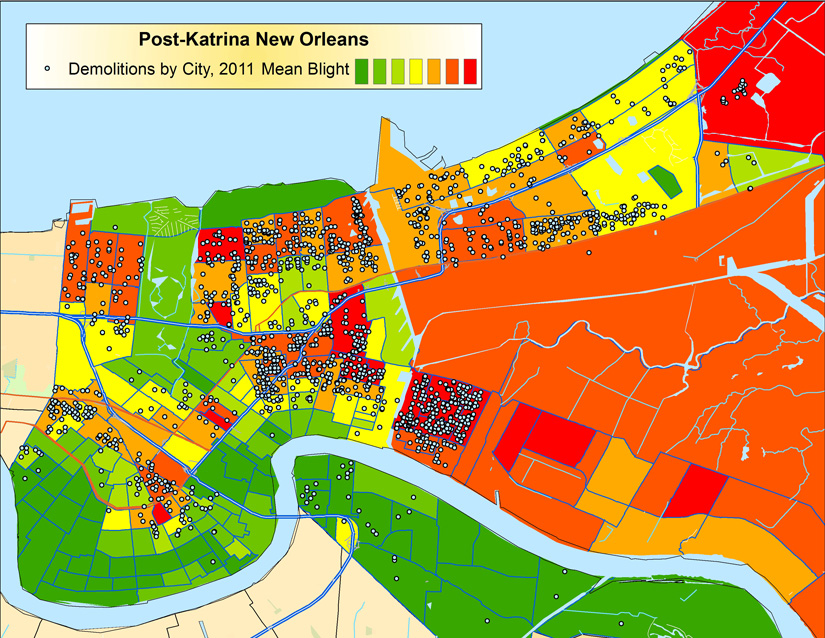
Source
of Demolitions data: City of New Orleans Department of Information Technology & Innovation:
Public data sets: data.nola.gov
Source
of Blight data: U.S. Department of Housing and Urban Development (HUD)
and the United States Postal Service (USPS): here
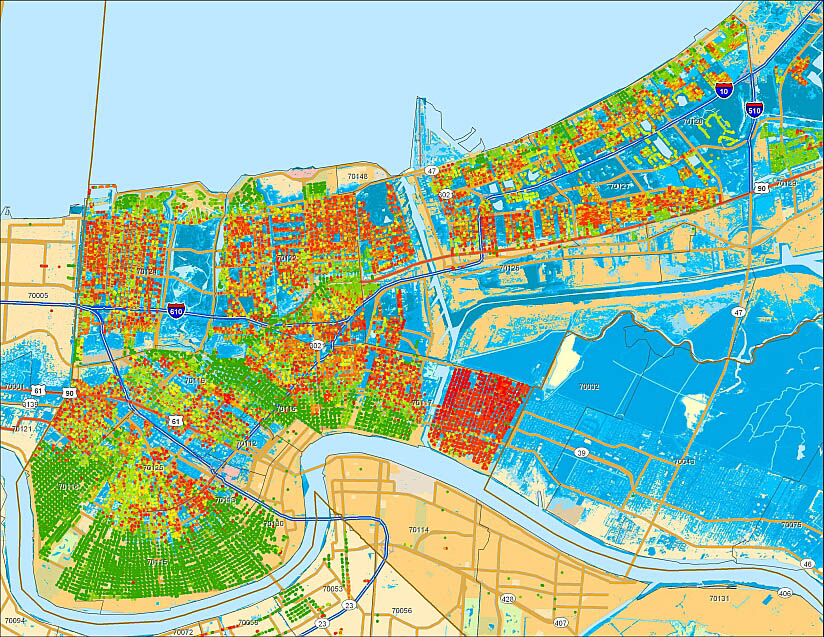
Repopulation, 2000-2010
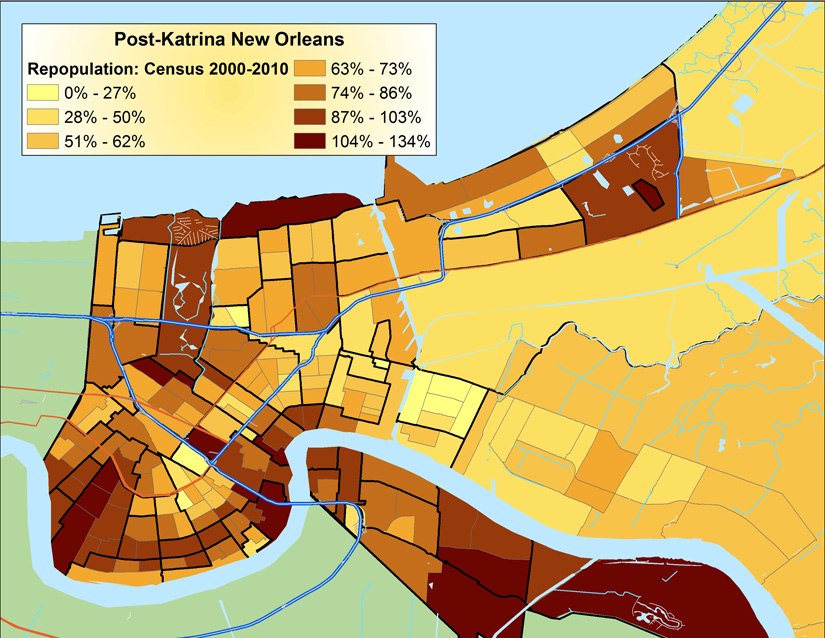
Source
of Repopulation data: U.S. Census
Note: repopulation shown in 2000 tract boundaries (provided by GeoLytics)
Damage
to Your Residence
Damage corresponds to flooded areas.
(see
below for close-up view)
Source of interview points: LSU Post-Katrina Surveys
Damage
to Your Residence (Orleans Parish close-up view)
Damage
corresponds to flooded areas.
(see above for
broader view)
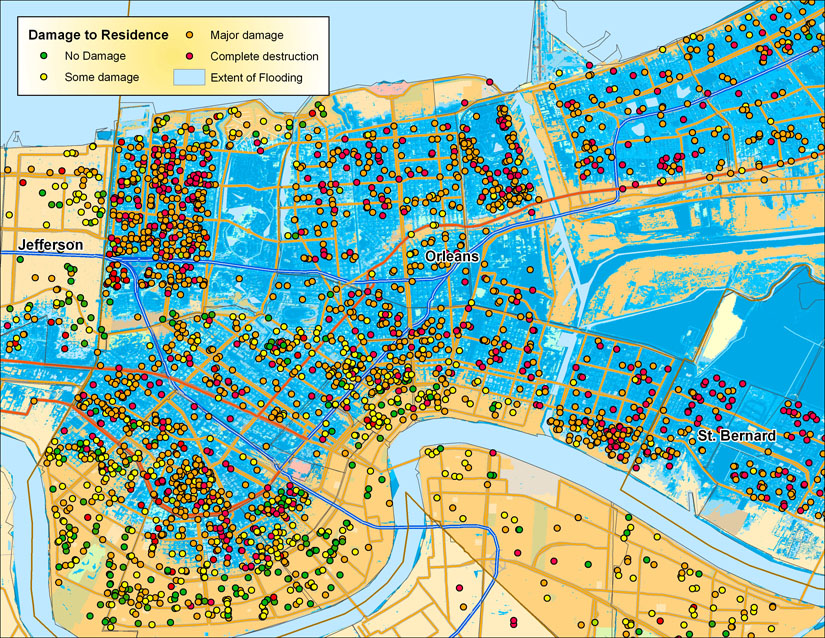
Source of interview points: LSU Post-Katrina Surveys
Your
Own Recovery
Recovery
does not fully correspond
to flooded areas.
What other factors play a role?
(Note! Interviews
were conducted at widely different times)
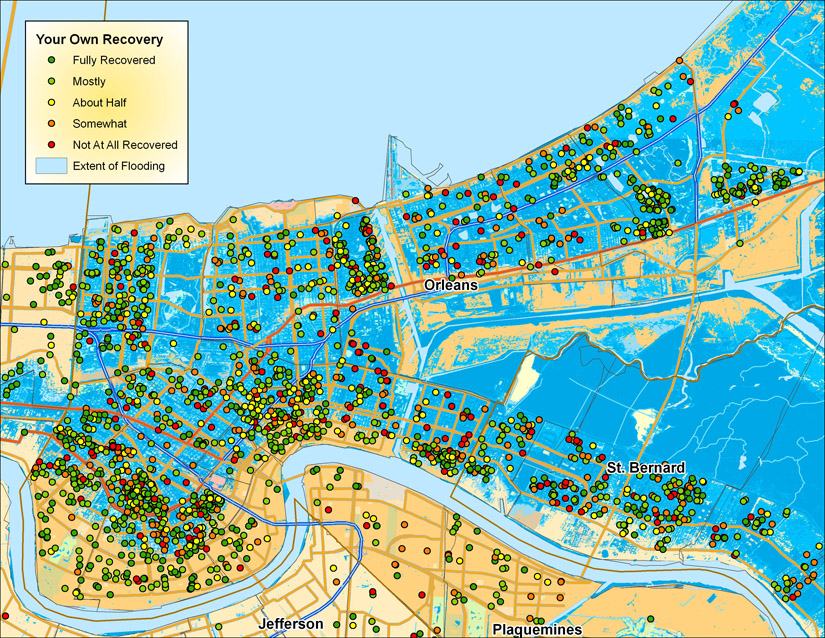
Source of interview points: LSU Post-Katrina
Surveys
"My
Neighborhood Can Be Protected from Flooding"
Optimism
also does not
fully correspond
to incidence of flooding.
What other factors play a role?
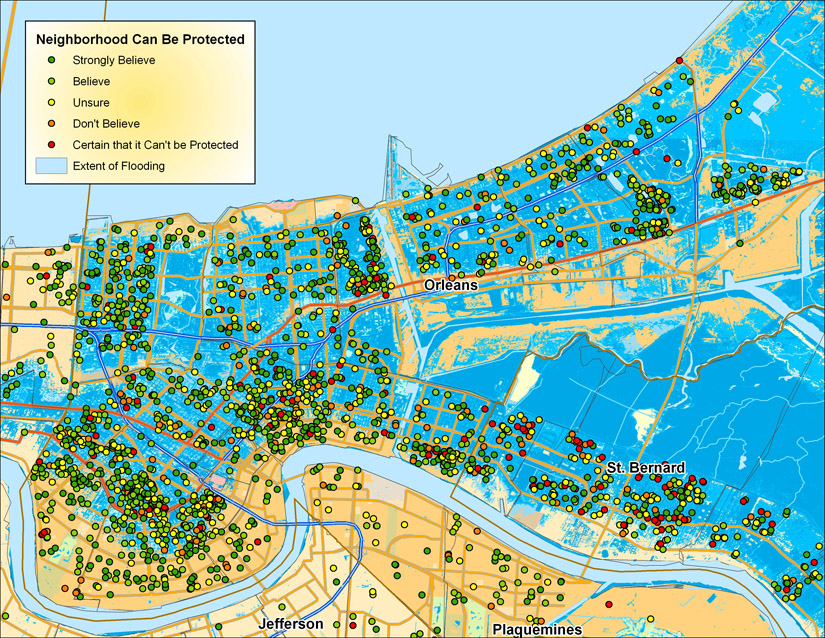
Source
of interview points: LSU Post-Katrina Surveys
"I
Have Enough to Repair or Replace Storm Damage"
Resources
for Recover do not
fully correspond
to incidence of flooding.
Income or Wealth certainly plays a role, too. What else matters?
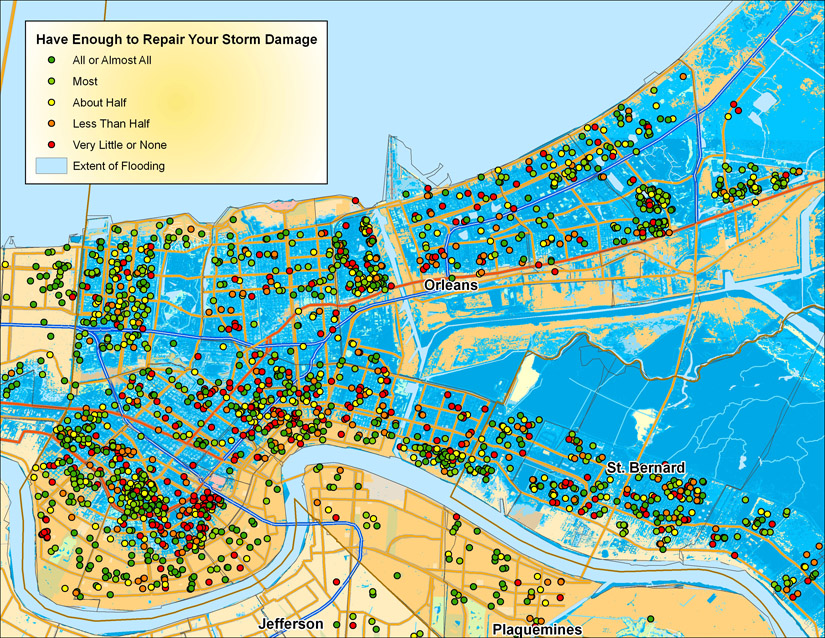
Source of interview points: LSU Post-Katrina
Surveys
Road Home Option 1 (Repair, Rebuild), as of December 2009
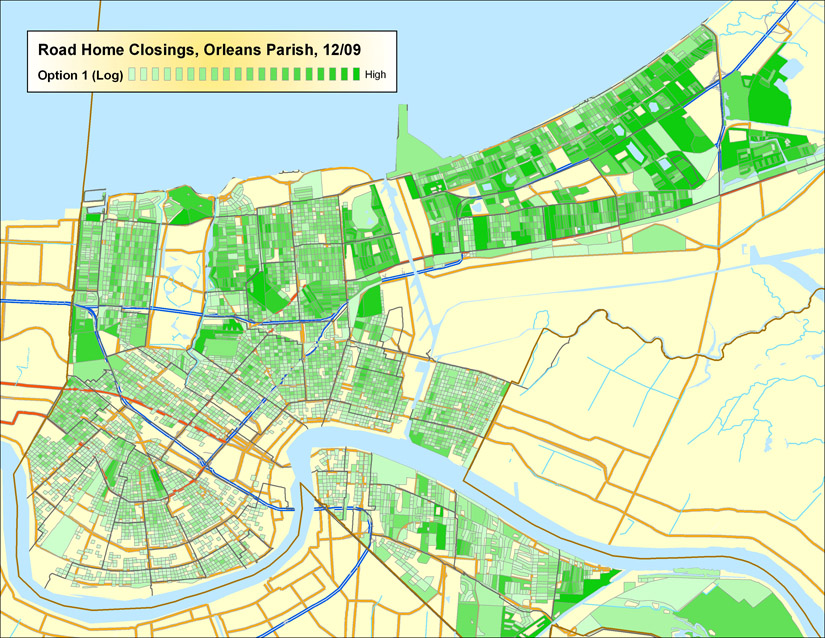
Source
of Road Home data: Louisiana Recovery Authority (LRA)
"Importance
of Health Care to Make Me Want to Come Back"
(with location of Medical Facilities)
People
who live farther from medical facilities stress their importance more.
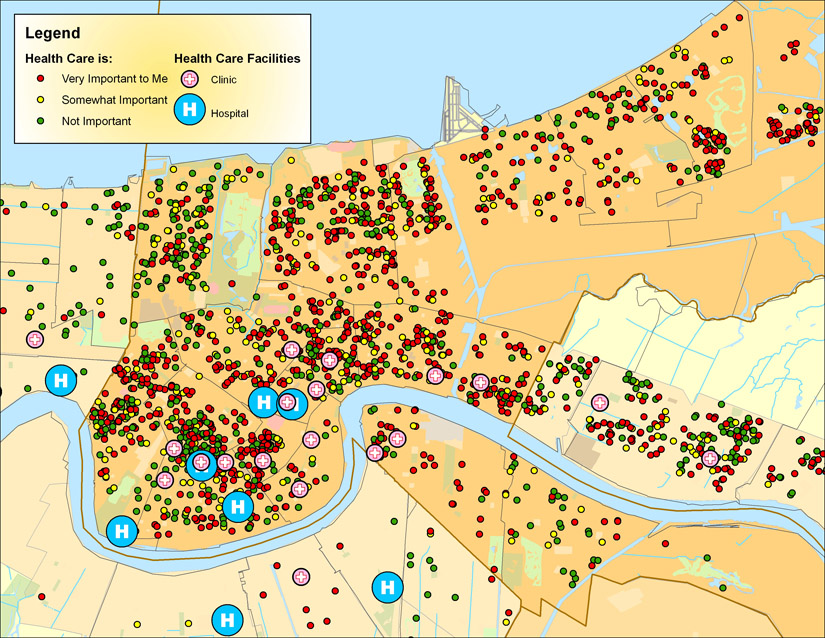
Source
of interview points: LSU Post-Katrina Surveys
Source
of Medical Facility locations: Greater
New Orleans Community Data Center
Violent Crime in New Orleans, 2007-12
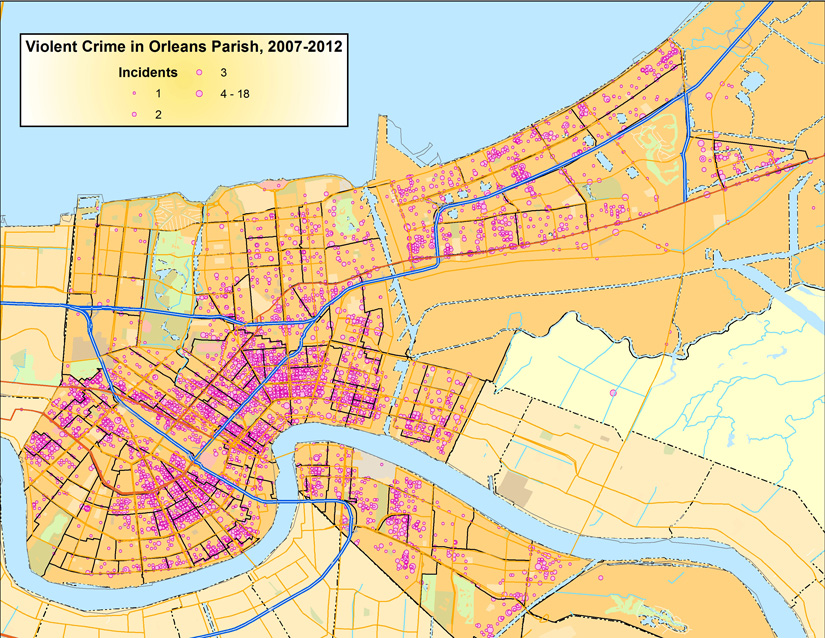
Source
of Crime locations: City
of New Orleans Crime Maps
Does Church Membership Reduce Violent Crime?
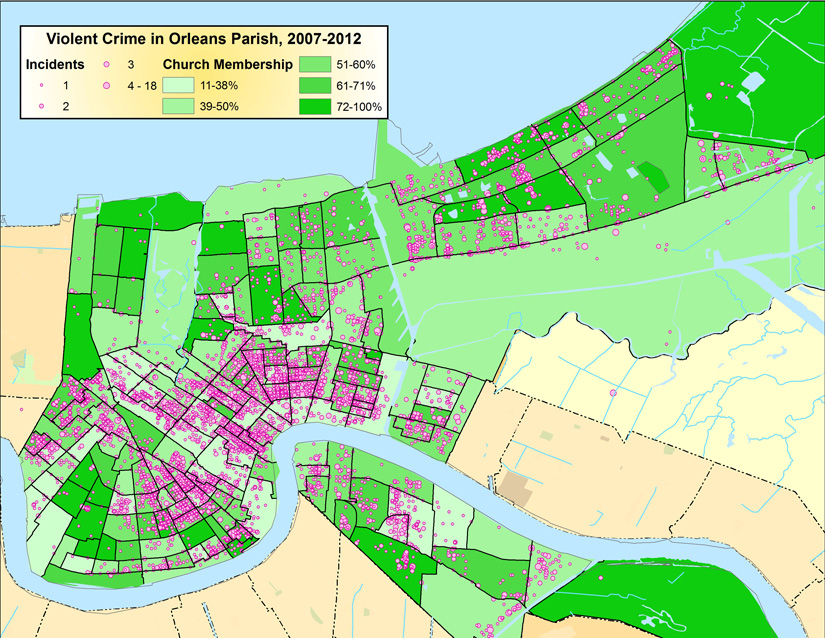
Survey
Data (N = 7,000) & Police Reports, Aggregated to Census Tract
(N = 182)
The correlation between crime & church membership is r = -.247**
The
New Orleans Jewish Community after Katrina:
National Moves
About
a quarter of the community left Greater New Orleans.
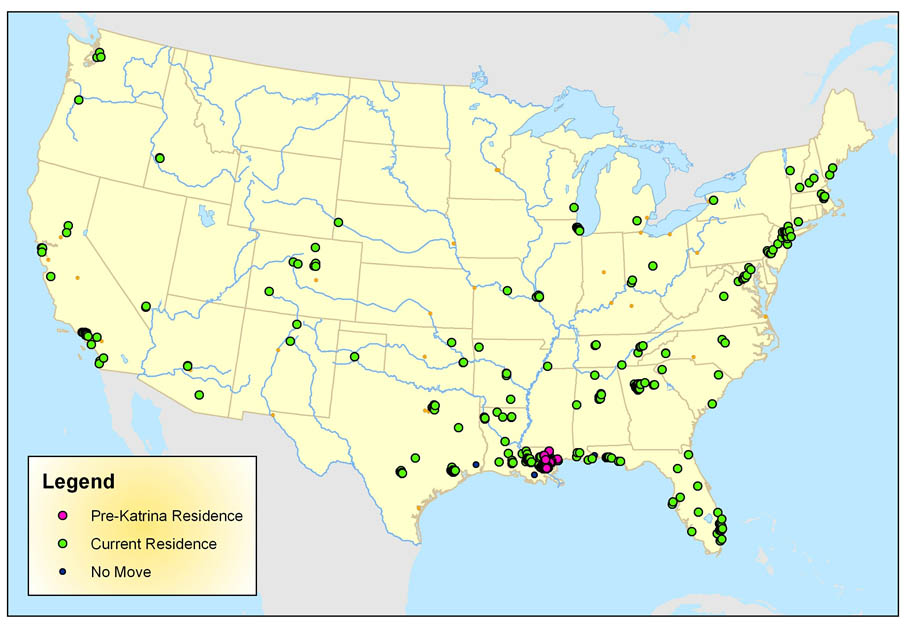
Source
of points: Jewish Federation of Greater New Orleans 2007 Community
Survey + Membership List
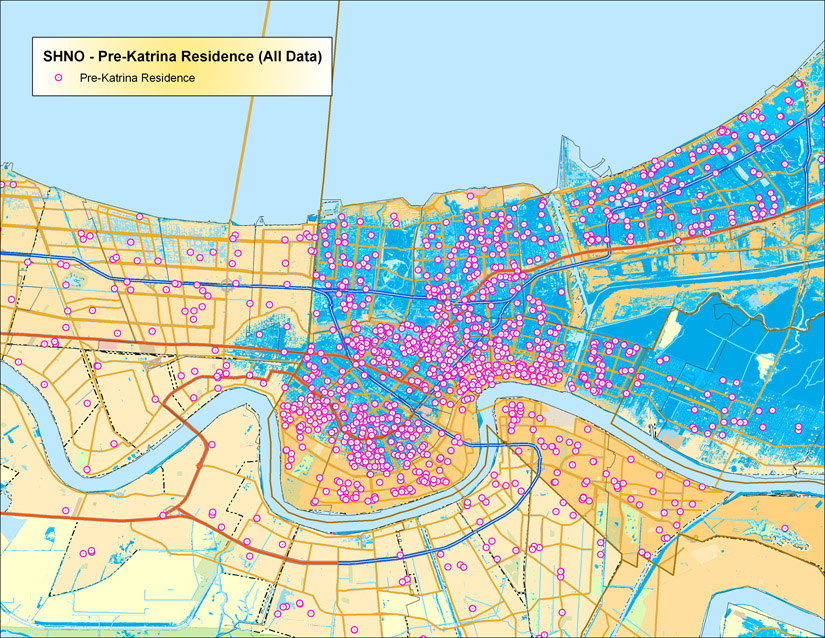
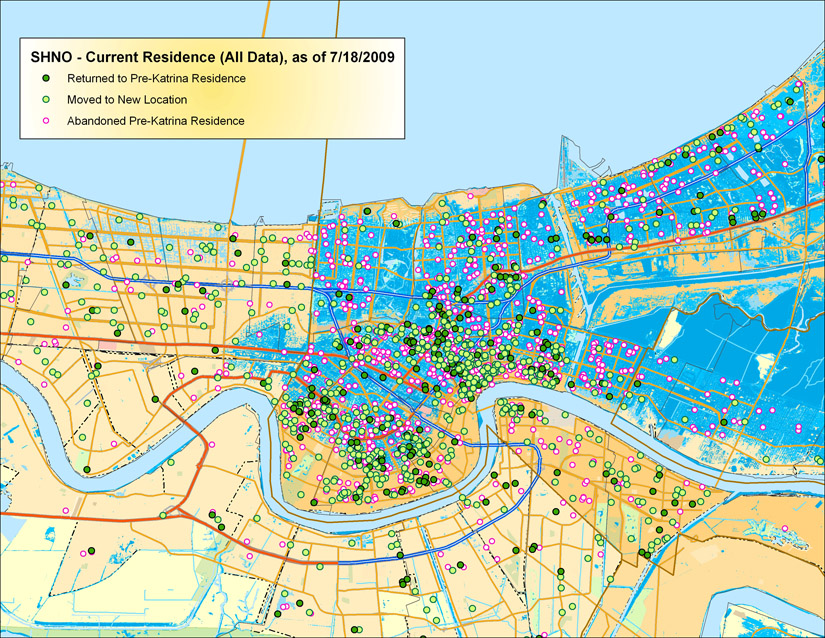
The
New Orleans Jewish Community after Katrina:
Moves within Greater New Orleans I
People
Moved out of the Heavily Flooded Areas.
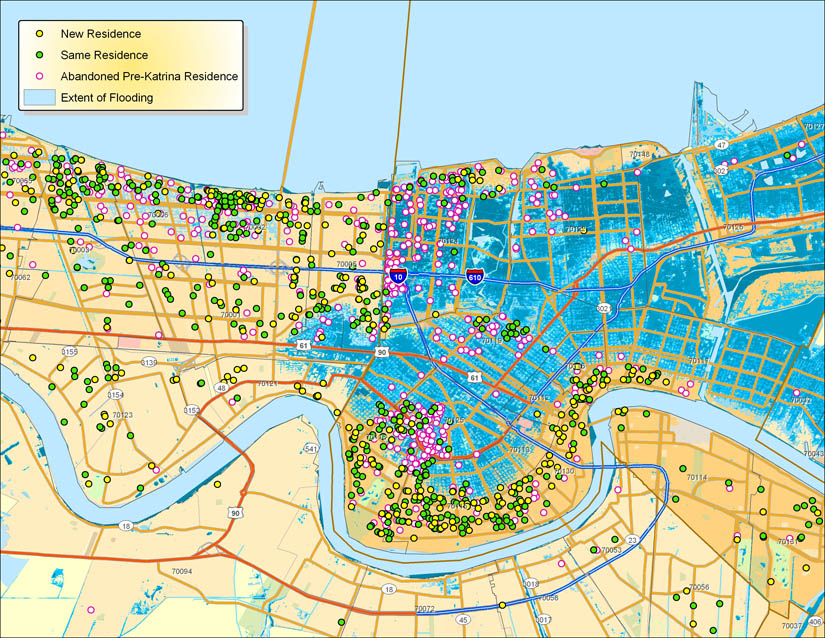
Source
of points: Jewish Federation of Greater New Orleans 2007
Community Survey + Membership
List
The
New Orleans Jewish Community after Katrina:
Moves within Greater New Orleans II
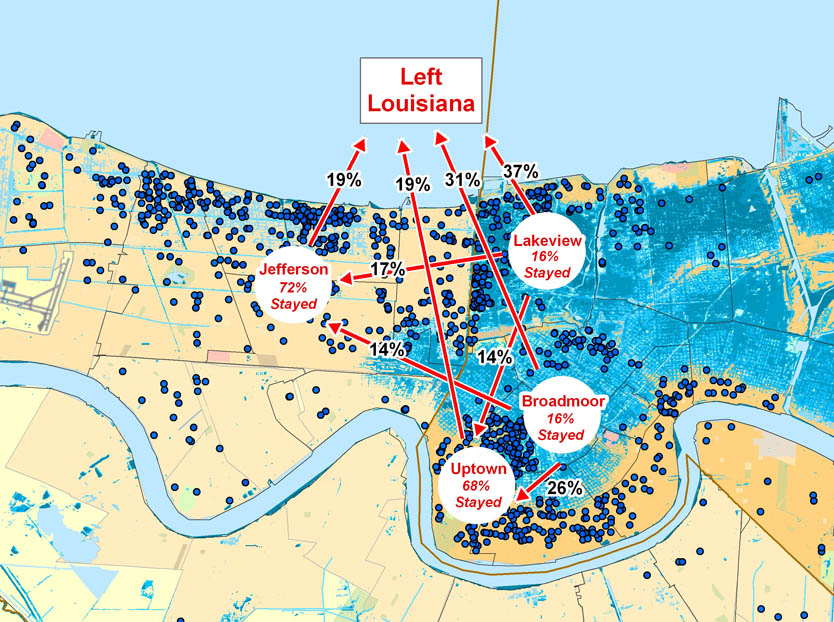
People
from different Flooded Areas moved to different Parts of Town:
- Suburbanites stayed in the Suburbs
- People from Broadmoor mostly moved Uptown
- People from Lakeview were in between.
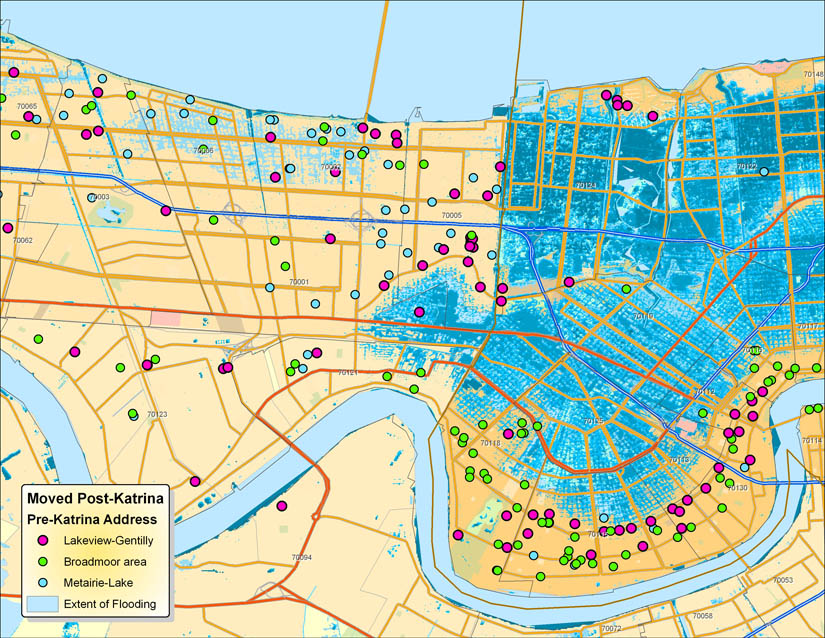
Source
of points: Jewish Federation of Greater New Orleans 2007
Community Survey + Membership
List
The
New Orleans Jewish Community after Katrina:
Analysis & Summary of Moves
Source
of points: Jewish Federation of Greater New Orleans 2007
Community Survey + Membership
List
Maps
of the New Orleans Music Community
Before and Since Hurricane Katriana
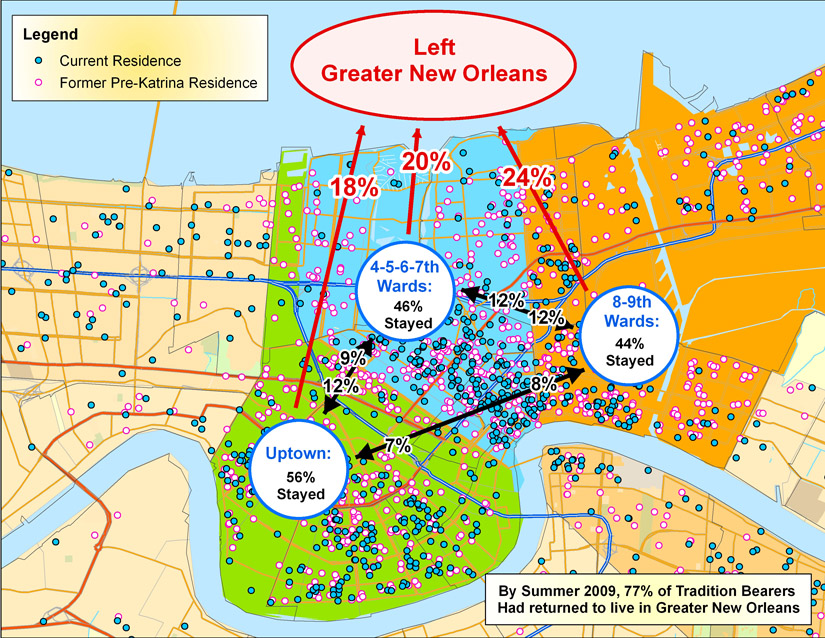
Changes
of Residence of Culture Carriers, Before & After Katrina
People
Moved out of the Heavily Flooded Areas.

Pre-Katrina Residence of Musicians
Musicians' Moves - Pre- and Post-Katrina
Musicians'
Moves - Pre- and Post-Katrina
(data adjusted to reflect 77% return rate)
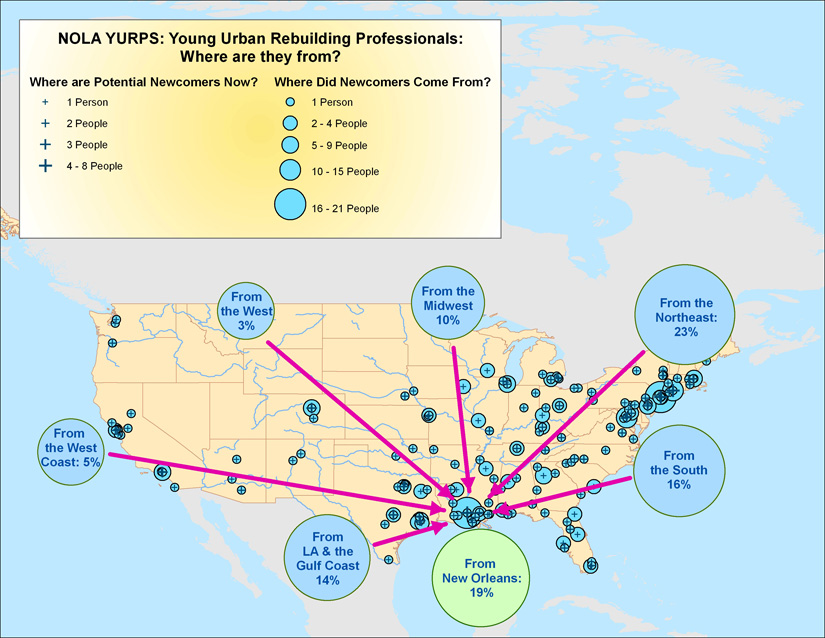
NOLA-YURP Survey – July/August 2008
"Young Urban Rebuilding Professionals"
(N = 328)
Census Tract Labels (pdf's): Zoom 1, Zoom 2, Zoom 3
Neighborhood Labels (pdf's): Zoom 1, Zoom 2
Back to my Post-Katrina work (start page)
All original elements of maps copyright (c) 2005-2013, by Frederick Weil, all rights reserved.
May be reproduced for scholarly purposes with attribution.
Some geocoding courtesy of USC WebGIS Services.